(Updated 8/4/2023 to include inter-seasonal storage requirements for green hydrogen heating.)
Introduction
A central issue in the low carbon future is large-scale energy storage. Due to the variability of renewable electricity (wind, solar) and its lack of synchronicity with the peaks of electricity demand, there is an essential need to store electricity at times of excess supply, for use at times of high demand. This article reviews some of the key issues concerning electricity storage. In particular, it compares ‘Green Hydrogen’ storage with the available alternatives.
Key Take-Aways (TLDR)
- The UK will need an estimated 65 GWh of intra-day storage and 16 TWh of inter-seasonal storage in the renewable electricity future. Both will have to be supplied at powers in the range 5-8 GW.
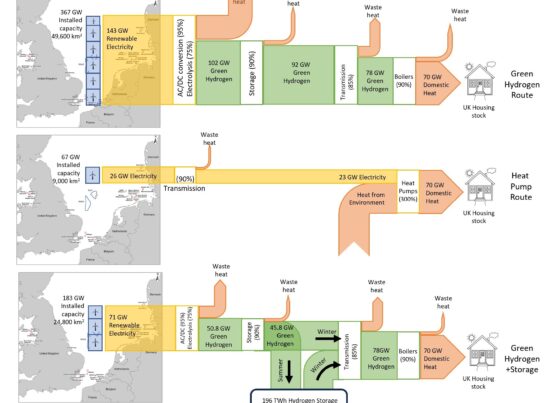
- If green hydrogen is burned in condensing boilers to heat UK homes, then up to 208 TWh of inter-seasonal hydrogen storage would be needed. This would require 2,080 x 500,000 m3 salt caverns operating at 200 bar, deep in the ground under the UK, It would reduce the renewable electricity requirement for heating by a factor of 2 to 193 GW. This would still be 18 times the current installed offshore wind capacity.
- The alternative to large-scale intra-day electricity storage is to have a significant over-supply of renewable electricity generating capacity and to curtail generation at times of low demand. To use this approach, the UK would need an additional 16GW of offshore wind generating capacity (1300 x 12MW turbines) on a typical day.
- The only viable candidates for grid-scale electricity storage are Pumped Hydro (which has limited potential for further development), Cryogenic (Liquid Air), Compressed Air and Green Hydrogen. Batteries of any chemistry are not sufficiently scalable to the storage capacities needed.
- Both Liquid Air (Cryogenic) and Compressed Air storage use standard off-the-shelf components for energy conversion. Liquid Air storage uses simple low-cost, dual-skin low-pressure storage vessels, whereas Compressed Air requires large, high pressure subterranean salt caverns. This limits the locations in which Compressed Air storage can be implemented and raises significant safety concerns.
- Liquid Air energy storage is well developed with a high technology readiness level (TRL). Pilot plants have been built and the first commercial grid-scale installation is currently under construction in the UK. Green Hydrogen energy storage has not been demonstrated at any significant scale, is at the lowest TRL and is far from being implementable at grid scale. Compressed Air storage has also not been demonstrated at grid scale.
- The economics of ‘arbitrage’ electricity storage are dominated by the ’round-trip’ efficiency of the energy storage system. Pumped hydro, Liquid Air and Compressed Air storage can have round-trip efficiencies up to 70%, whereas Green Hydrogen has a round-trip efficiency of around 30-35%. This means that the ‘break-even’ sale price of electricity stored via Green Hydrogen is around 2.2 times the break-even sale price of electricity stored via other available technologies.
- Green Hydrogen electricity storage will not be economically competitive with the alternative grid-scale storage technologies at any wholesale electricity price. It is unlikely that the fundamentals of this calculation will change significantly with time. A more sophisticated ‘Levelized Cost of Storage’ (LCOS) analysis gives the same conclusion.
- The only way to make Green Hydrogen competitive as an electricity storage process would be to provide government subsidies of around 17p/kWh of stored electricity.
Energy and Power Requirements
Intra-day storage Requirements
In the UK’s nuclear and fossil-fuelled electricity system of 30 or more years ago, large scale nuclear and coal-fired thermal power stations provided a constant ‘base load’ of power. The peaks in demand were supplied by switching-on ‘open cycle gas turbine’ generators, that can run up to full load in minutes, plus some hydro-electricity, and oil-fired steam turbines that can also be switched on quickly from a warm start.
This situation is rapidly changing. Fig.1a shows the variation in the UK’s electricity supply on a mild autumn day in October 2020. (Note that electricity supply=demand if there is no storage). The electrical power was provided by many sources. Fig. 1b shows the colour key for Fig.1a, and also lists the power contributions from each source at the daily peak, which occurred at 17:40 (the dashed vertical line in Fig. 1a). Eight Nuclear power stations provided a consistent baseload of approximately 6.1 GW (the grey stripe at the bottom of Fig. 1a). A large proportion of the electricity was provided by Combined Cycle Gas Turbines (CCGT) – the orange area of Fig. 1a. At 17:40, this amounted to 21.6 GW. Wind energy, provided by 6500 wind turbines (cyan area) was relatively constant through the day, contributing just over 2 GW at 17:40. Solar (yellow area) peaked around mid-day, when the sun was shining but was negligible at 17:40. (Sunset was at 18:00.) Fig 1b also shows that the ‘France Interconnector’ (a cable running to France) was importing 1 GW at 17:40. A similar amount was imported from Belgium.
The peak power consumption was 39.3 GW at 17:40 on October 16. The minimum was 22.9 GW, at around midnight. The average value across the whole 24 hour period was 33 GW, as shown by the horizontal blue dashed line on Fig. 1a. The total electricity consumption during the day was 790 GWh, which is the area under the curve ( also equal to the area under the average line). The peaks and troughs in demand were managed mainly by varying the amount of electricity supplied by CCGT and pumped hydroelectricity.


In the future electricity system, powered entirely by renewables (and nuclear), with no CCGT, it will be necessary to follow the demand variation using electricity storage.
Intra-day Storage
Making the very rough assumption that the power available from renewable electricity will be constant through the day (which can be reasonably true for off-shore wind power); the amount of storage needed to smooth-out daily variations can be estimated by equating the red and green shaded areas, above and below the dashed blue ‘average’ line in Fig 1c. This gives an estimated ‘intra-day’ storage requirement of around 65GWh. That storage would have to be charged and discharged over about 8 hours, at a power of approximately 8GW. 65GWh is about 8% of the 790 GWh total electricity consumption on October 16.

These numbers: 65GWh and 8GW are probably underestimates because of 3 factors:
- renewable electricity generation isn’t constant through a typical day or through the year;
- greater daily peak-trough variation can occur at other times of the year;
- the calculations do not account for the expected future increase in electricity consumption as additional sectors of the energy system are electrified: specifically transport and heating of buildings.
Conversely, electrification of transport provides opportunities for storing electricity through charging demand management and ‘vehicle to grid’ (V2G) systems. Storage of heat also provides similar opportunities (see later). So the overall effect of their electrification on storage requirements is unclear.
Load Shedding
The alternative to building generating capacity for the average electric power requirement and storing the peak to trough variation would be to install sufficient generating capacity to meet the peak demand and then ‘curtail’ (switch-off) generators when they aren’t needed at other times of the day.
For our example on October 16th, this would require renewable electricity generation of 39.3GW at 17:40. Of this, only 22.9GW would be needed at midnight, meaning that up to 16.4GW (42% of the installed capacity) would be switched-off for some of the day.
The average ‘power factor’ of wind energy in the North Sea is 38.9% (see this article). So if all of the peak power was to be provided by off-shore wind turbines, the 39.3 GW of electricity would require 39.3/0.389 = 101 GW of installed wind turbine capacity, corresponding to 8,400 of the largest (12MW) offshore wind turbines.
If the average power of 33 GW was to be provided by the installed base and the peak to trough variation managed through intra-day storage, as described above, then the installed base of turbines would need to be 33/0.389 = 85 GW, corresponding to 7100 turbines. The cost of providing the energy storage must be compared with the cost of installing and maintaining the additional 1300 wind turbines to decide which is more financially attractive.
Of course, the economic calculation is more complex than that, because the ‘levelized cost of electricity’ depends on the utilization of the generating assets. So the economics of electricity generation changes if some of the wind turbines are to be curtailed for up to half of the day.
The remainder of this article discusses electricity storage. Load shedding won’t be discussed further.
Inter-Seasonal Storage Requirements
The intra-day storage requirements calculated above do not account for the need to level-out inter-seasonal variations in power demand that occur on a 6-monthly cycle. The same type of calculation can be used to estimate the amount of electricity that needs to be stored in summer to provide peak power in winter when the average daily demand is higher (more heating and lighting). Using data for the UK’s electricity consumption in 2019 from gridwatch.co.uk, and assuming that the amount of renewable electricity generation is constant throughout the seasons, the required energy storage is very roughly estimated to be 16,300 GWh (16.3 TWh). This is approximately 250 times the intra-day estimate of 65 GWh. The additional power needed to charge and discharge the inter-seasonal storage system is around 5-6 GW. These estimates (16.3 TWh, 5-6 GW) do not account for the expected future increase in electricity demand, as per factor 3 above. There is also a strong effect of the seasonal variation of wind… it is windier in the winter months when more heating is required, than in the summer months, where additional load is caused by air conditioning.
There is one other way to think about the inter-seasonal energy storage requirement of the UK, which is to consider the national heating demand instead of the electricity demand and to assume that heat is provided by burning green hydrogen in condensing boilers. The analysis is done in an accompanying blog post on this website. To summarise the results: if green hydrogen was used for heating, a huge amount of renewable electricity would be needed – about 385 GW of installed capacity during the winter months. However if sufficient hydrogen storage was provided in salt caverns, deep underground, the amount of renewable electricity generating capacity could be reduced by half to 193 GW. The hydrogen generated and stored in the summer months would be added to the hydrogen generated in the winter. The amount of storage required would be about 208,000 GWh (208 TWh). This is about 13 times the inter-seasonal storage estimate for the electricity system above.
Storage Options
There are many applications for electricity storage: from rechargeable batteries in small appliances to large hydroelectric dams, used for grid-scale electricity storage. They differ in the amount of energy that has to be stored and the rate (power) at which it has to be transferred in and out of the storage system. This article is concerned with large-scale intra-day and inter-seasonal storage needed to balance-out fluctuations in energy supply and demand at national scale.
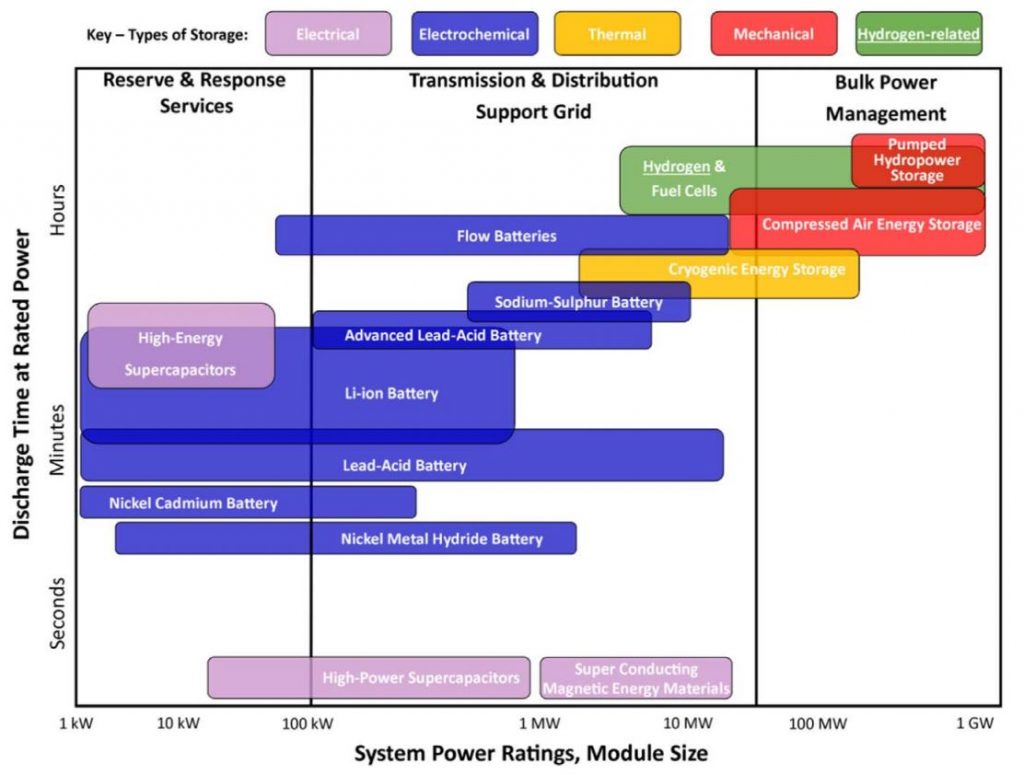
Power (measured in units of Watts (W) or kW, MW, GW) is the rate of use of energy (measured in Watt.hours (Wh) or kWh…). If the power is constant, the time to fully charge or fully discharge a storage system is given by Time=Stored Energy/Power. These quantities are shown schematically in Fig. 2, from [1], for large-scale energy storage systems. The figure compares storage technologies in terms of their discharge times at rated power vs their charging /discharging power. The technologies that are most suitable for grid-scale electricity storage are in the top right corner, with high powers and discharge times of hours or days (but not weeks or months). These are Pumped Hydropower, Hydrogen, Compressed air and Cryogenic Energy Storage (also known as ‘Liquid Air Energy Storage’ (LAES)).
Pumped Hydroelectricity is the incumbent standard for grid-scale electricity storage. It can store and generate electricity at high powers, with large storage capacities/discharge times. However it requires large water reservoirs in hilly terrain. A large proportion of the available sites in the UK have been used and environmental concerns prevent others from being developed. So pumped hydro has reached something near its maximum uptake in the UK. There are currently no new pumped hydro projects under construction.
Proponents of a ‘Green Hydrogen‘ economy propose to solve the electricity storage problem by using excess electricity to electrolyse water and make Hydrogen; storing the Hydrogen in ‘geological storage’, (underground salt caverns); and converting it back to electricity using fuel cells at peak times. This process is shown in the left branch of Fig. 3. It has the advantage of potentially high storage capacity, depending on the internal volume of the salt caverns. However, the locations for hydrogen storage are limited by the available geology, which limits the flexibility.
The US-based Energy Storage Association says that up to 100 GWh of Hydrogen could be stored in a salt cavern with volume of 500,000 cubic metres, at a pressure of 200 bar. This would be sufficient to cover the estimated intra-day requirement of 65 GWh. To provide the 16.3 TWh estimated inter-seasonal storage for the electricity system, about 160 such salt cavern facilities would be needed. If inter-seasonal energy storage was needed for heating the country’s homes with green hydrogen, it would take 2,080 such salt caverns, as calculated in https://www.csrf.ac.uk/blog/hydrogen-for-heating/.
Table 9 (p151) of the 2019 International Energy Association report ‘The Future of Hydrogen’ [2] states (without any supporting references) that there are 3 suitable salt cavern sites for hydrogen storage in the USA and another 3 sites in the UK. It also says there is “little experience with depleted oil and gas fields or water aquifers for hydrogen storage (e.g. contamination issues)”. This raises questions about whether the quantity of storage available is anywhere near sufficient to meet demand.
Hydrogen storage at this scale is completely undeveloped. There are no examples or prototype systems in existence. Its technology readiness is at the lowest level on the TRL scale. Given this starting point, it is difficult to imagine how sufficient Green Hydrogen storage could be built in time to significantly affect the UK’s electricity or heat decarbonisation trajectories by 2050.
Compressed Air storage follows a similar pattern. Electricity is used to compress air and force it into similar underground salt caverns. When electricity is needed, air is released back to the atmosphere through air turbines that drive electricity generators. Although small-scale compressed air storage systems have been built, the salt cavern technology is, as yet, untested in this application.
Compressed air is highly energetic and complex to manage from a safety point of view. Industrial pressure vessels require regular safety inspections and proof testing to ensure that microscopic cracks do not grow to cause rupture, which can be explosive. Subterranean salt caverns would need to be monitored continuously, regularly pressure tested and inspected so that their safety is ensured. Further information is available from the Health and Safety Executive.
Cryogenic (Liquid Air Energy Storage – LAES) is an emerging star performer among grid-scale energy storage technologies. From Fig. 2, it can be seen that cryogenic storage compares reasonably well in power and discharge time with hydrogen and compressed air.
The Liquid Air Energy Storage process is shown in the right branch of figure 3. It has 3 main steps: ‘charging’ which involves liquefaction of air using a Claude cycle; ‘Storage’ of the liquid air in standard double skin, low pressure tanks (large-scale ‘thermos flasks’); and ‘Recover’, which involves expanding the liquid air through a turbine to generate electricity. Despite not being very well known, this storage system has high technology readiness level (TRL), is safe and benign, uses standard off-the-shelf components and can be located anywhere in the country, using a small land area… no need to be near salt caverns. Liquid air storage has the advantage that the energy conversion and storage systems are uncoupled. Need more storage?… add some more low cost storage tanks.
In 2018, start-up company Highview Power opened a 15MWh ‘grid scale’ demonstrator plant in Bury near Manchester. It can nominally provide 5MW of power for 3 hours. Highview recently started construction of the first commercial facility ‘CRYObattery’ with 250MWh storage capacity that can nominally provide 50MW of electricity for 5 hours. This technology is in its infancy and can be scaled-up substantially.
Batteries of various chemistries are possible for small and medium scale electricity storage, but the technologies do not scale as well as the other high capacity systems because the energy conversion and storage systems are coupled. Consequently there is no significant reduction in cost per kWh with increasing storage capacity… each additional kWh of battery storage costs about the same as the first.. Batteries also have finite lives. They can only be charged and discharged a limited number of times. They use expensive and scarce materials such as Lithium and Cobalt and so have significant environmental resource impact.
There are also a number of technologies for ‘Thermal Energy Storage‘ (TES). These enable excess heat to be stored and used hours, days or even months later. Thermal energy storage can vary in scale from individual buildings to entire districts. It is most efficient when integrated with heating and cooling systems using heat pumps. TES can be used to capture waste heat and/or used to increase the efficiency of a Liquid Air Energy Storage system. There are also some high temperature ‘molten salt’ thermal energy storage systems that can be used for electricity storage. These are sometimes used to store heat collected by concentrated solar power systems. An advantage of thermal storage systems is that the cost of the storage medium is generally low, so the storage capacity can be large at relatively low cost.
Conclusion: The technologies that can be used to supplement existing Pumped Hydro for grid-scale electricity storage are: Green Hydrogen, Compressed Air and Cryogenic (Liquid Air) storage. Of these, Liquid Air looks most promising for intra-day storage. It has a high technology readiness level, unlike the competing technologies which are untested at scale. It is not limited to locations near underground salt caverns.
The Importance of Energy Efficiency
The cost of energy storage is strongly dependent on the ’round-trip’ energy efficiency of the storage process (the amount of energy that comes out of the storage device divided by the amount that went in).
The left branch of Fig. 3 shows that if you start with 100kWh of renewable electricity, produce and store Green Hydrogen; then pass the Hydrogen through a fuel cell to generate electricity, only 32kWh is returned to the electricity grid after the storage process. This is because 68% of the input energy is wasted as low grade heat during the process. The major losses occur in the electrolysis step, which is at best 75% efficient and the fuel cell, which is about 50% efficient [3]. The ’round-trip’ efficiency (electricity-Hydrogen-electricity) is therefore approximately 32%.

Other electricity storage technologies are significantly more efficient than Green Hydrogen. These include pumped-storage hydroelectricity (round-trip efficiency of 70-85%), lead acid batteries (80-90%), Li-ion batteries (85-95%); flywheels (70-95%) and compressed air (40-70%). Reference [5] provides an informative comparison of the various technologies.
As an example of a more efficient storage technology, cryogenic (Liquid air) storage has a round-trip efficiency of up to 70% as shown in the right branch of Fig. 3. This means that 30% of the energy is lost as low grade heat in the round trip [4]. The process steps involve some losses through the change of state of nitrogen (gas-liquid-gas), but these steps are much more efficient than the chemical reactions needed to make and split hydrogen (water-Hydrogen-water). Other large-scale storage technologies, including compressed air and pumped hydro have similar round-trip efficiencies – in the region of 70%.
Conclusion: A number of storage technologies such as liquid air, compressed air and pumped hydro are significantly more efficient than Green Hydrogen storage. Consequently much less energy is wasted in the energy storage round-trip.
Economics
A Simple Financial Analysis
Suppose a company was set up to purchase electricity from the grid off-peak, when the wholesale market price is low and sell it back to the grid when the price is high. The company could make money on the difference between the sale and purchase prices and use that to fund its capital and operating costs and generate a profit. This business model is known as ‘arbitrage’. Suppose, for example, that the purchase price was 10p per electricity ‘unit’ (kWh). This is the equivalent to £10 per 100 kWh, as shown in the top block of figure 3.
If the company used Green Hydrogen to store the electricity, 68 kWh of the original 100 kWh would be wasted by the inefficient process and only 32 kWh would be available to sell back to the grid. The value of that 32 kWh would be £3.20 at the initial purchase price, so inefficiency would have thrown away £6.80 of the original electricity purchase. This means that the storage company would have to sell the stored electricity for 10.00/0.32 = 31.25 p/kWh (ie £31.25 per 100kWh) in order to break even on their £10 purchase. Add to this, the interest payments on capital for their plant, operating cost and profit… and they would need a sale price nearer to 40 p/kWh in order to maintain their business.
The right-hand side path shows that if you use liquid air storage, pumped hydro or compressed air storage with an efficiency of 70%, then 70 kWh of stored electricity would be available to sell back to the electricity grid. Consequently, the break-even sale price would be 10/0.7 = 14.29 p/kWh or £14.29 per 100kWh. This simple example shows how important energy efficiency is to the arbitrage business model. No consumer would purchase electricity for 31 p/kWh from the Green Hydrogen storage company when they could purchase it at 14 p/kWh from the Liquid Air storage company.
The ratio of the break-even prices 31.25/14.29 = 2.2 comes from the round-trip efficiencies (70/32 = 2.2). This means that whatever the price of electricity purchased by the arbitrage storage company, the break-even sale price for electricity stored via hydrogen will be 2.2 times higher than the price of electricity stored via liquid air. The Green Hydrogen storage company could not compete at any wholesale electricity price and is unlikely to have a viable business.
Since the number 2.2 is based on fundamental thermodynamics, it is very unlikely to change significantly in future. Individual steps in the conversion processes may improve slightly in efficiency with technology development, but most of the processes involved are mature and only small improvements can be expected. The basic conclusions are unlikely to change. The only way to make the Green Hydrogen process competitive with Liquid Air would be to provide government subsidies of at least 31-14 =17 p/kWh.
This simple ‘break-even’ calculation is provided to illustrate the importance of round-trip efficiency in energy storage. The calculation ignores a number of cost elements, most importantly, the capital cost of the storage facility and the maintenance and staffing costs. These can make a significant difference in the cost of storage and hence the decision of which technology to deploy. A more comprehensive economic analysis is provided in the next section.
One more point: The very low electricity prices that are currently being seen due to over-supply at some times of the day are unlikely to be the ‘new normal’. They are an artefact of the current situation where the electricity market is distorted because of the rapid rise in renewables, without a commensurate increase in storage capacity. In the near future, as the electricity storage market matures and there is much more electricity storage capacity at grid scale, there will be a significant demand for off-peak electricity from arbitrage storage companies. These companies will purchase and store the excess and then sell it back to the grid at a higher price, later in the day or year, thereby pushing-up the price at times of oversupply. In this free market, inefficient storage systems are not likely to be competitive. Scalable systems with high efficiency will be the winners.
Conclusion: Round-trip energy efficiency is a key component of the competitiveness of grid-scale energy storage technologies. Consequently storage of electricity using Green Hydrogen is significantly disadvantaged compared with readily-available alternatives, such as pumped-hydro, Cryogenic (Liquid Air) energy storage or compressed air storage.
Levelized Cost of Storage
A more rigorous financial analysis involves calculating the ‘levelized cost of storage’ (LCOS), which is defined as the total annualized cost of the initial capital investment, interest, replacement costs, disposal and/or salvage value, and variable and fixed operating costs over the lifespan of the facility divided by the total yearly energy output from the system [6].

Fig. 4 from [4] shows the LCOS for a number of grid-scale energy systems, calculated over 30 years. Liquid Air Energy Storage (LAES) can be seen to be competitive with pumped hydro, at 202-233 $/MWh (15-18 p/kWh) and half the cost of Lithium-ion batteries. Compressed air storage (CAES) is projected to be even lower cost than Pumped Hydro. Sodium storage (molten salt) is significantly more expensive at present. The LCOS for Green Hydrogen is not shown on this diagram because the technology doesn’t yet exist and it isn’t a viable competitor in this market.
Compressed air storage can have a comparable efficiency to Cryogenic (Liquid Air) under some circumstances [4] and is more suited to longer-term, inter-seasonal storage than Cryogenic. So it is possible that a combination of liquid air and compressed air may ultimately be the best solution. Such a system would have a far lower LCOS than Green Hydrogen.
Note, however, that the amount of energy storage needed to solve the inter-seasonal problem is immense… hundreds of days of consumption at power levels of 5 or 6 GW. Even if all the salt caverns in the UK and surrounding waters were exploited for compressed air storage, it seems very unlikely that sufficient storage could be built to satisfy the inter-seasonal storage needs of the UK.
Conclusion: The levelized cost of cryogenic and compressed air electricity storage are comparable with pumped hydro. Cryogenic storage has the advantage that it can be located anywhere around the country and doesn’t need to be near to particular geological features – hilly terrain or salt caverns. Compressed air has the advantage of longer storage times, making it more suitable for inter-seasonal storage. However, there is still unlikely to be sufficient capacity for inter-seasonal storage in the UK.
Overall Conclusions
The push towards Green Hydrogen for electricity storage is flawed. Storing electricity via Green Hydrogen wastes 68% of the energy which means that the re-sale price has to be uncompetitively high. Green Hydrogen is unlikely to be able to compete financially with the alternative grid-scale electricity storage technologies that have much higher round-trip efficiencies.
Because of its low technology readiness, it is unlikely that sufficient Green Hydrogen storage could be built in time (for 2050) to significantly impact the UK’s electricity decabonisation trajectory. Consequently, electricity storage is not a reason for adopting a hydrogen economy in the UK.
Liquid Air Energy Storage is a promising technology. It has a high technology readiness level; can be built at grid scale in essentially any location; has a good round-trip efficiency; is safe and benign. Liquid Air storage is well suited to the UK’s intra-day storage needs. Compressed Air Storage is the most promising technology for inter-seasonal storage, though it is currently at low TRL. Its much higher round-trip efficiency than Green Hydrogen makes it a significantly more economic choice.
It seems unlikely that the UK could ever build sufficient energy storage capability to fully satisfy the inter-seasonal storage requirements – whatever technology is used. Some other solution is needed.
Postscript: Interconnectors
Inter-seasonal energy storage is clearly a very difficult problem to solve, because of the enormous amounts of energy that need to be stored: 16 TWh or more. If sufficient storage can’t be built in time, it will derail the UK’s plans for electricity decarbonisation and cause the national 2050 net zero commitment to be missed.
There is an alternative to storing electricity. Interconnectors can be used to transfer it between countries: from locations with a temporary over-supply to locations with a temporary shortage. Figure 1 above shows that interconnectors already play a significant part in the UK’s energy mix; with electricity regularly imported and exported to Ireland and European neighbours across the English Channel.
The world’s first commercial High Voltage Direct Current (HVDC) interconnector was developed by ABB in Sweden in 1954. Since then, more than 200 HVDC interconnectors have been built around the world. The big advantage of HVDC interconnectors is that transmission energy losses are about half of those of High Voltage Alternating Current (HVAC) transmission. HVDC interconnectors can be laid underground and many of the existing systems are undersea.
Interconnector technology is rapidly advancing and the rated power of HVDC links has been rising steadily over time. The largest example in the world is currently the ultra-high voltage DC (UHVDC) line between Xinjiang and Anhui in China, which transmits up to 12GW over a distance of 3,293 km, using a DC line voltage of 1100 kV (1.1 million Volts) [7].
In the future world powered by renewable electricity, interconnectors could transmit electricity East-West around time zones to reduce the need for intra-day storage; or North-South, between latitudes to resolve the problem of inter-seasonal electricity variation. For example, compare the Xinjiang-Anhui interconnector (12GW, 3293 km) with the UKs 8 GW inter-seasonal storage power requirement, estimated above and the 1700 km distance between England and Algeria in North Africa, where solar energy is plentiful. It seems that appropriate interconnectors could supply much of the UK’s daily electricity variation and possibly, much of its inter-seasonal electricity requirements.
Of course, electricity storage is not just a UK problem. Solar electricity from Northern Australia could be supplied to Indonesia via a 3000 km UHVDC interconnector or to Singapore at 3500 km. This is likely to be much more profitable than generating hydrogen and transporting it from Australia to Asian cities by ship, with 68% energy losses in the round-trip energy conversions (Fig. 3). Other examples abound around the globe.
References
[1] Moller, KT, et al. ‘Hydrogen – A sustainable energy carrier’, Progress in Natural Science: Materials International. Volume 27, Issue 1, February 2017, Pages 34-40. https:/www.doi.org/10.1016/j.pnsc.2016.12.014
[2] Anon ‘The Future of Hydrogen’, IEA, June, 2019, 199pp https://www.iea.org/reports/the-future-of-hydrogen.
[3] Bossel, U. ‘Does a Hydrogen Economy Make Sense?’, Proc IEEE, Vol 94, No 10, pp1826–1837, 2006.
[4] Joyeux, D. ‘A new contender for energy storage’, Ingenia, Issue 78, 2019. https://www.ingenia.org.uk/ingenia/issue-78/energy-storage
[5] Anon, ‘Energy Storage in the UK: An Overview’, Renewable Energy Association, 2nd Edition, 2016. https://www.r-e-a.net/wp-content/uploads/2019/10/Energy-Storage-FINAL6.pdf
[6] Schmidt, Melchior, Hawkes and Staffell, ‘Projecting the Future Levelized Cost of Electricity Storage Technologies’. Joule, Volume 3, Issue 1, P81-100, Jan 16, 2019. https://doi.org/10.1016/j.joule.2018.12.008
[7] Fairley, P. ‘China’s State Grid Corp Crushes Power Transmission Records’, IEEE Spectrum, 10 January, 2019. https://spectrum.ieee.org/energywise/energy/the-smarter-grid/chinas-state-grid-corp-crushes-power-transmission-records