(Updated 14/4/2023 to include: * the option of large-scale inter-seasonal hydrogen storage to reduce the renewable electricity generating requirement and * updated grid carbon intensity factors (2022).)
The most frequently proposed ways to heat buildings in a low carbon future are using hydrogen to power hot water boilers or electricity to power heat pumps. There are two low-carbon ways to make hydrogen: These are known as ‘green’ and ‘blue’. This article compares the various options on the basis of energy efficiency, carbon emissions, infrastructure requirements and technology readiness.
Key Take-Aways (TLDR)
- Heat pumps are far more efficient than Green Hydrogen for heating buildings. The ‘wind-to-heat’ energy consumption of heating via heat pumps is about 1/5.5 that of green hydrogen, for delivery of the same amount of heat. Therefore the energy generation costs for heat pumps are likely to be about 1/5.5 of those for Green Hydrogen.
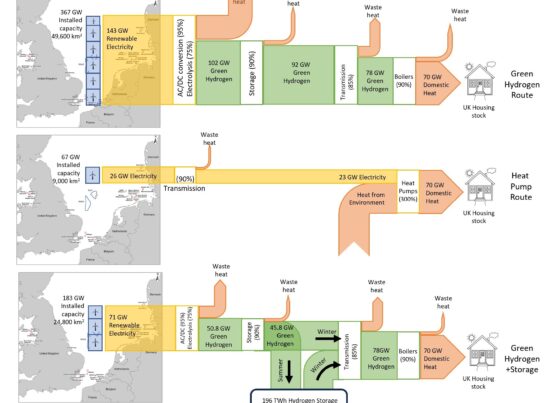
- As a consequence of the inefficiency of the Green Hydrogen route, it would require an inordinate amount of renewable electricity to heat the UK’s buildings. With no hydrogen storage, approximately 367 GW of offshore wind generating capacity would be required. This is about 33 times the current installed capacity. If 2,180 hydrogen storage salt caverns could be built in time for 2050, each with a volume 500,000 m3, then only half the amount of renewable electricity generation would be needed, ie 184 GW. This is still 17 times the current installed capacity.
- The heat pump route would require significantly less additional renewable electricity; about 67 GW of installed offshore wind generation – about 6 times the current installed capacity.
- In the UK in 2020, heating a building with an electric space heater creates about 20% lower carbon emissions than heating the same building with a natural gas boiler. This percentage will improve with time as the electricity supply becomes cleaner (lower carbon).
- Electric space heating will always generate about half the carbon emissions of Green Hydrogen boilers. Electric space heaters are available off the shelf now and require no additional infrastructure.
- The Blue Hydrogen route for heating buildings would require a 25% increase in the amount of natural gas imported into the UK, taking the imports to 60% of national consumption. This would be detrimental to the balance of trade and energy security.
- Neither the Green Hydrogen nor the Blue Hydrogen route is ‘clean’ Both generate substantial carbon emissions. In 2022, the Green Hydrogen route emitted 50% more carbon than burning natural gas in a condensing boiler.
- Heat pumps generated 1/4 of the emissions of a natural gas boiler in 2022 and this will reduce significantly with time as the electricity grid becomes cleaner. They are the most effective way to reduce carbon emissions from heating. Heat pumps are available off-the-shelf, now.
- Blue Hydrogen will always generate significant ‘fugitive’ CO2 emissions, that escape into the atmosphere. Consequently, use of Blue Hydrogen for heating would prevent the UK government from meeting its legal commitments for ‘net zero’ emission by 2050.
- It is unlikely that the infrastructure needed for Blue or Green Hydrogen could be built in time for 2040.
- Government policy should promote the of use of heat pumps for heating new and retrofitted buildings and should reject Hydrogen as an option for heating.
Green Hydrogen
‘Green hydrogen’ is created by passing renewable electricity through pure (distilled) water. This splits the water into hydrogen and oxygen gases. The hydrogen can be compressed and pumped through pipes to consumers and then burned in hydrogen-ready condensing boilers to heat buildings.
Energy Efficiencies
The efficiencies of the main steps in the Green Hydrogen process are shown in the right path of figure 1. Multiplying these efficiencies together gives an overall end-to-end efficiency of 49%. The largest proportion of losses occurs in the electrolysis step, which is at best 75% efficient. The consequence is that 100kWh of renewable electricity would yield 49 kWh of heat in the building.
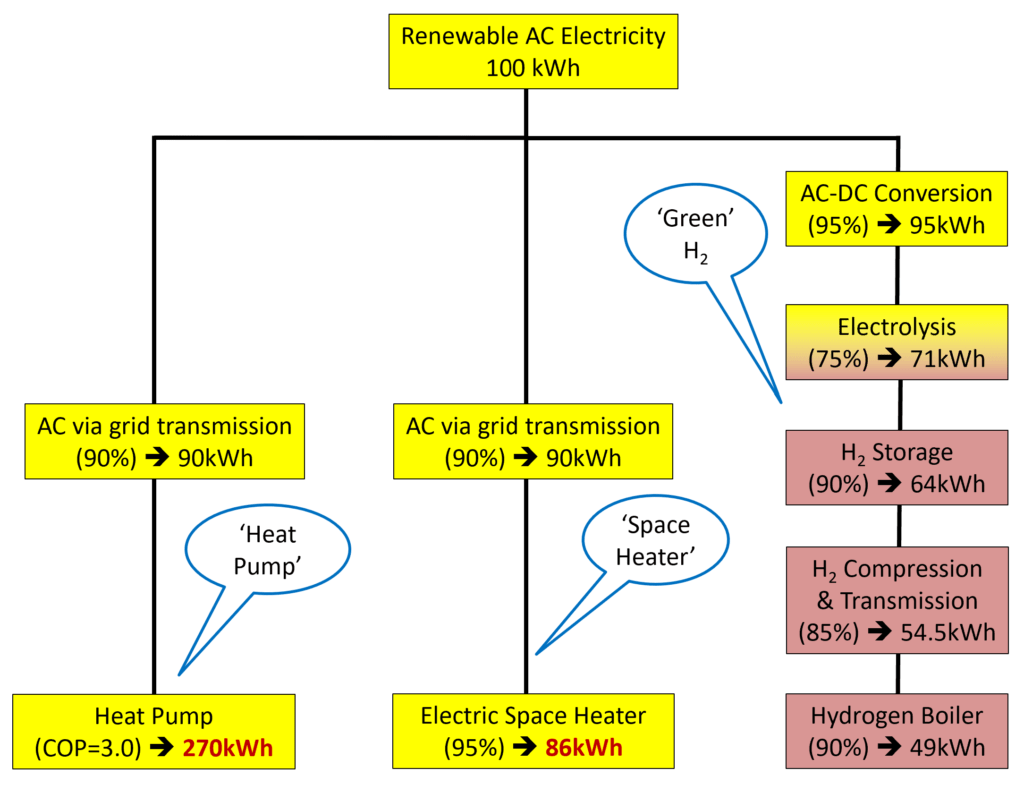
The middle branch of figure 1 shows transmission of the electricity via the electricity grid to a consumer, where it powers a 95% efficient electric space heater (of the type you can purchase in a department store). This route would deliver 86kWh to the building: nearly 90% more heat than a Green Hydrogen boiler, for the same amount of renewable electricity. A space heater can be plugged-into the existing electrical infrastructure.
The left hand branch of figure 1 shows use of grid electricity to power a heat pump. The big advantage of this route is that the heat pump delivers 3-4 times more heat into the building than the electricity it uses. (See a nice explanation of how this works in ‘Sustainable energy without hot air‘ by the late David Mackay). Assuming a realistic ‘Coefficient of Performance’ (COP) of 3.0; the output of the heat pump route would be 270kWh of heat.
Conclusions: An electric space heater will deliver nearly 90% more heat per kWh of input electricity than a Green Hydrogen boiler. A heat pump would deliver (270/49) = 5.5 times more heat from the same amount of electricity as the Green Hydrogen route.
What are the implications of this factor of 5.5?
Firstly, the country would have to build 5.5 times the number of additional wind turbines or solar panels or nuclear power stations to generate the electricity in the Green Hydrogen case than for heat pumps. Consequently, consumers would have to pay 5.5 times the price for the energy to heat their homes. Alternatively, the government would have to subsidise the cost of hydrogen, which would have a permanently damaging effect on the economy. There would also be very substantial environmental impact in building and operating the turbines.
Secondly, in 2018, the UK used about 300 TWh of natural gas for ‘domestic use’ – mainly heating buildings [1]. (1 TWh is 1 billion kWh). Making the crude assumption that the heating was done over 6 months of the year, the 300TWh would correspond to an average heating power of about 70GW.
If this 70GW of heat was supplied by heat pumps, it would require 70/2.7 = 26 GW of additional renewable electricity. (For comparison the average electric power demand of GB throughout 2019 was 31GW.) This 26GW could be provided by offshore wind turbines, as follows:
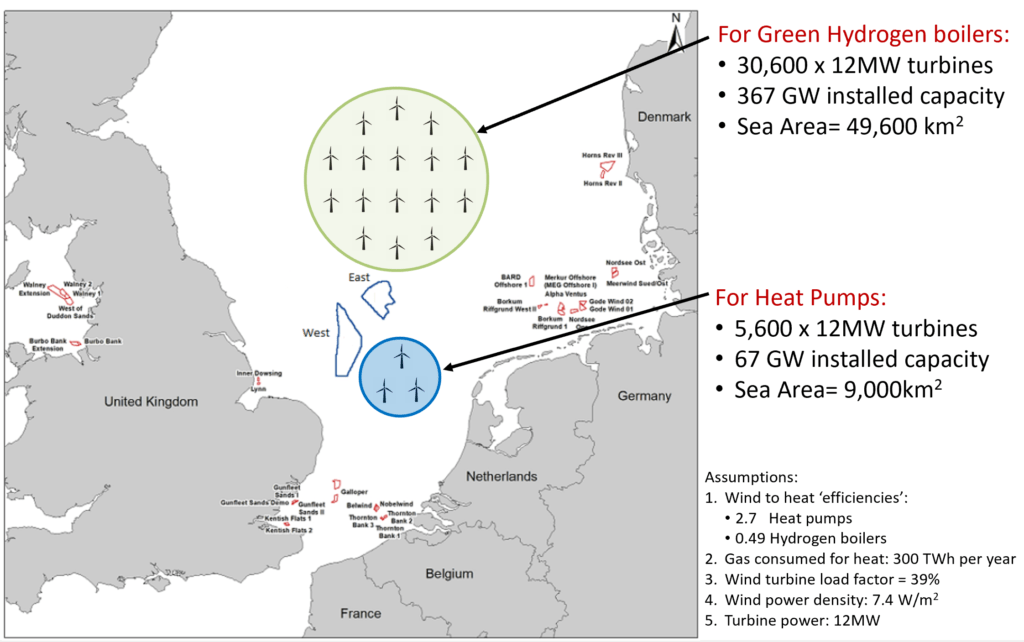
- The average ‘power factor’ of wind energy in the North Sea is 38.9% [2]. So the 26GW of electricity would require 26/0.389 = 67 GW of installed wind turbine capacity, corresponding to 5,600 of the largest (12MW) offshore wind turbines.
- The average power density of recent large scale wind turbine projects in the North Sea is 7.4W/m2 [3], so these turbines would require a sea area of approximately 9,000 km2 (a circle of diameter 107km).
If the 70GW of heat was supplied by boilers burning green hydrogen, it would require 70/0.49 = 143GW of additional renewable electricity.
- Using the same calculation as above, this would require 70/(0.49×0.389)=367 GW of installed wind turbine capacity, which could be supplied by 30,600 x 12MW turbines.
- This would correspond to a sea area of 49,600km2 ( a circle of diameter 251km).
The scale of these numbers is shown in figure 2. This chart was adapted from a figure in [3], by overlaying scaled areas of 9,000 km2 and 49,600km2. It can be seen that if the UK was to use green hydrogen for heating, a large area of the North Sea would need to be covered in wind turbines. Has the scale of this challenge been recognised by those advocating Green Hydrogen?
For comparison, all existing offshore wind installations in the North Sea are plotted in the small red polygons on figure 2. There are currently 2,300 offshore wind turbines in UK waters, with an installed capacity of 11GW [2]. So generating sufficient green hydrogen for heating UK buildings would require this to be increased by a factor of nearly 33. Some of the sea areas under consideration for future expansion in ‘Round 3’ of the UK’s offshore wind development at Dogger Bank are the blue polygons labelled ‘East’ and ‘West’ in figure 2. In total the Round 3 projects amount to another 18GW, of planned capacity which will take the total to about 30GW. This is less than half that required to decarbonise the UK’s heat by the heat pump route.
There are two important caveats here, both about energy storage:
The first caveat is that there is a very significant variation in gas demand for heating from hour to hour. The peak demand can be as much as 170GW, with a ramp rate up to 60 GW/hour. [4]. Natural gas infrastructure can absorb this variation for short periods as it is equipped with various kinds of effective storage. Improved thermal insulation, increased ‘thermal mass’ in buildings, local heat storage and ‘demand management’ in the energy system can help reduce the peak in an electrical heating system. So any future system for heat energy must include significant energy storage. This is the subject of another blog, elsewhere on this website.
The second caveat is that a key assumption in the analysis above is that there is no large storage capacity for hydrogen in the energy system. This means that the hydrogen has to be generated at the same time as it is used for heating. Under this scenario, renewable electricity generated in the ‘summer’ (6 non-heating months from mid spring to mid autumn) would not be used to make hydrogen for heating. It would have to be either shed/curtailed or used for some other industrial purpose (eg manufacturing fertilizer or steel). This is probably not a good assumption. In practice there is likely to be some hydrogen storage available in the system and this would reduce the demand for renewable electricity generation in the ‘winter’ heating months (mid autumn to mid spring).
The upper limit of this scenario would be to store all the hydrogen generated during the summer months. It would then be possible to generate green hydrogen all year round at half the rate and use the stored, summer-generated hydrogen to supplement the winter-generated hydrogen. This ‘upper bound’ of storage would correspond to half of the annual heating requirement. So instead of requiring 367 GW of installed offshore wind turbines, it would only be necessary to have half this amount: 184 GW. This is still a huge, impractical amount of renewable electricity, that would require 15,300 x 12MW turbines and a sea area of 24,800 km2.
The equivalent of half of the 300 TWh of natural gas used to heat houses in winter would have to go via this route, as stored hydrogen, ie 150 TWh. The stored hydrogen would be fed into the gas transmission network, piped to the end users and burnt in condensing boilers. Accounting for the energy losses, using the efficiencies in Figure 1, the amount of hydrogen to be stored would be about: 150 TWh /(0.9×0.85×0.9) = 218 TWh.
The US-based Energy Storage Association says that up to 100 GWh of Hydrogen could be stored in a salt cavern with volume of 500,000 cubic metres, at a pressure of 200 bar. To store 218 TWh would therefore require 2,180 such salt caverns. This is likely to be the maximum amount of hydrogen storage needed by the UK under any circumstances. Each spherical salt cavern would have a diameter of 100m. Assuming that they could be constructed on a square grid with two diameters spacing between caverns, the total land area needed for this storage would be about 196 km2 (ie 14 km x 14 km). Of course, a very large buffer zone would be needed between the storage caverns and any areas of population, in case of mishap… An explosion in one cavern would likely set off a cataclysmic chain reaction in the rest!
So the choices for green hydrogen generation are either:
- 367 GW of offshore wind generation, or
- 184 GW of offshore wind generation + 2,180 salt caverns for hydrogen storage
It is doubtful that either system could be built by 2050.
Conclusions: The renewable energy generating capacity needed for heating with green hydrogen would be extreme: 367 GW, requiring the UK’s existing offshore wind generating capacity to be increased by a factor of 33. An alternative would be to have half the amount of renewable electricity generating capacity (184 GW) and supplement this with 2,180 salt caverns, each with a volume of 500,000 m3, for inter-seasonal hydrogen storage. Use of heat pumps would require the existing offshore wind generating capacity to be increased by a factor of around 6.5… still a very significant amount, but much more achievable.
Carbon emissions
It is commonly thought that heating using green or blue hydrogen is ‘clean’, ie zero carbon. This is not correct. Even if there was sufficient electrolyser capacity available to generate the hydrogen, it would be necessary to use grid-mix electricity because there will not be sufficient renewable electricity for decades (as explained above).
Projections of the future carbon ’emissions intensity’ of the electricity grid are published in the UK Treasury’s ‘Green Book’ which provides ‘guidance on how to appraise policies, programmes and projects’ [5]. In 2022, the grid-average factor recommended by the Green book was 144 gCO2e per kWh of electricity generated. The ’emissions intensity’ of the grid, was therefore measured to be 144 gCO2e/kWh. This intensity is gradually reducing as coal-fired power stations are phased out and the amount of renewable generation (wind, solar) increases. So electricity is becoming ‘cleaner’ with time. [Note that the Green Book factors are based on the annual Department of Energy Security and Net Zero (DESNZ) emissions factors for reporting. These are sourced from the UK’s GHGI (Green House Gas Inventory) and DUKES (Digest of UK Energy Statistics), both of which are based on actual emissions and generation data.]
The projected future carbon emissions from heating the UK’s buildings can be estimated roughly using the Green Book carbon intensity projections in [5] and dividing by the ‘wind-to-heat’ efficiencies in figure 1. For example, in 2022 a heat pump using grid electricity generated carbon emissions of 144/2.7=53 gCO2 per kWh of heat delivered. Similarly, a space heater generated carbon emissions of 144/0.86 = 167 gCO2 per kWh of heat delivered and a Green Hydrogen boiler generated carbon emissions of 144/0.49=294gCO2 per kWh of heat delivered. (The ratio of the Green Hydrogen to the heat pump, ie 294/53 is the same factor of 5.5).
The results of this calculation using future projections of emissions intensity are shown in figure 3 for Green Hydrogen boilers, space heaters and heat pumps. (Note that this calculation is approximate only.. If the huge amount of Green Hydrogen implied by this calculation was generated by new renewable electricity plant, the grid intensity would fall significantly below the Green Book projections in [5].) Also plotted in red on figure 3 is the level of carbon emissions generated by a modern condensing boiler burning natural gas, which is approximately 200 gCO2 per kWh of heat delivered.
From figure 3 it can be seen that Green Hydrogen boilers emitted about 75% more carbon than natural gas boilers in 2022 and will not deliver lower carbon emissions than natural gas boilers until 2026. Conversely, heat pumps delivered about 1/4 the CO2 emissions of a natural gas boiler in 2022 (ie 75% reduction), reducing to just 18gCO2 per kWh of heat delivered by 2035. Green Hydrogen boilers won’t reach the emissions performance of 2022’s heat pumps until around 2033. In 2022, heating buildings using electric space heaters generates about the same carbon emissions as gas boilers and much lower emissions than Green Hydrogen.
Conclusion: Heat pumps reduced carbon emissions by 75% in 2022 compared to gas boilers: delivering immediate, deep cuts in carbon emissions. Green Hydrogen emitted 75% more carbon than conventional gas boilers in 2022 and will not reach the emissions of 2022’s heat pumps until 2033.

Technology Readiness
- Technology for large-scale electrolysis is not well developed. The largest electrolysis plant in the world is currently being built by Hydrogenics in Canada. It has a capacity of 20 MW. Approximately 7,500 of theses plants would be needed to generate the 150GW of Green Hydrogen, just to heat the UK’s buildings. Unless there is a major development in electrolysis technology, it seems unlikely that the installed capacity of electrolysis plants could reach the necessary scale by 2040.
- Heat pumps (and space heaters) are standard, mature, off-the shelf technology that can be purchased now. The International Institute of Refrigeration estimates that there are currently 220m heat pumps in use around the world [6]. They come in two main varieties: ‘air-source’ heat pumps are better for retrofitting existing buildings and ‘ground-source’ heat pumps are more efficient, though more expensive, and easier to install in new buildings [7].
There are some disadvantages of using heat pumps – for example, they require some modification to the heating system in each building and they are currently more expensive than gas boilers (though the prices are expected to drop as demand increases). However these issues pale into insignificance compared with the magnitude of the task of generating sufficient electricity for green hydrogen.
Conclusion: Heat pumps are available off-the-shelf now. It is unlikely that Green Hydrogen could be scaled to heat the UK’s building stock by 2040.
Blue Hydrogen
The alternative method for generating Hydrogen is to make it from methane (natural gas) by a process called steam methane reforming (SMR). SMR strips the Carbon atoms from Methane (CH4), creating CO2 and Hydrogen (H2). If the resulting CO2 is captured and stored ‘sequestered’ permanently underground (see figure 4), the resulting hydrogen is labelled ‘Blue’. The Blue Hydrogen can be compressed and pumped through pipes to consumers and then burned in hydrogen-ready condensing boilers to heat buildings.
It has been argued that ‘Blue’ Hydrogen generated by SMR could replace natural gas for heating and transport in a Hydrogen Economy. For example, the ‘H21’ project in the North of England [8] proposes to extract natural gas from the North Sea oil fields, convert it to Hydrogen by SMR at facilities on the UK coast, inject the Hydrogen into the National Transmission System (NTS = the ‘gas grid’) and pump the CO2 back into empty oil/gas wells, to be sequestered under the sea (‘Carbon Capture and Storage’ – CCS).

Infrastructure Requirements
Hydrogen has a significantly lower energy content per unit volume (‘Lower Calorific Value’ LCV=10.8 MJ/m3 ) than Methane (LCV=35.8 MJ/m3 ) [9]. See the top two central boxes in Fig. 4. The factor of 35.8/10.8 = 3.3 means that transferring the same amount of energy to consumers through the NTS using Blue Hydrogen instead of Methane, at the same transmission pressure, would require all gas pipes in the system to carry 3.3 times higher volume flow rate of gas. This would require replacement of all compressors/pumping stations in the gas network with hydrogen-compatible versions having about 3 x the power consumption. Furthermore, much of the gas pipeline network would have to be replaced to make it compatible with hydrogen: preventing leakage and embrittlement. (This problem is recognised by the H21 project, which plans to install an extensive network of new Hydrogen gas mains across the North of England [8].)
Of course, it would also be necessary to replace all natural gas boilers with a hydrogen-ready variety and to build the SMR and CCS plant to generate the hydrogen. There is no commercial-scale CCS facility in the UK. It would have to be developed and built before any blue hydrogen could be generated.
According to the database of CCS facilities run by the Global CCS Institute, there are 25 ‘commercial’ CCS facilities operational in the world today. Most of these are small scale and sequester less that 1 Mega tonnes of CO2 per annum (Mt/a). The sum total capacity of these plants is 38 Mt/a. The largest in the world is a plant at Shute Creek in Wyoming, USA, with a capacity of 7 Mt/a. Its CO2 is injected into oil wells and the revenue from enhanced oil recovery pays the costs of running the CCS plant. To put 38 Mt/a into perspective: a total of 37 Gt of anthropogenic CO2 was emitted by humans in 2019. So the total sequestration capacity of the world is currently 1/1000 (0.1%) of global emissions. This industry has a long way to grow to make a significant impact on global CO2 emissions.
A recent article by Deign in [10] explains that the reason for low adoption of CCS is that there is currently no viable business case because the price of Carbon is too low:
“For carbon capture to take off in a meaningful way, companies will need to have a clear financial incentive. That means having carbon pricing comfortably above the cost of capture, usage and/or storage”
Until this situation is resolved, the only way to finance CCS plants (apart from additional oil recovery revenues) will be through government subsidies. Therefore the industry will not be able to scale to the level needed to sequester the CO2 generated in the manufacture of Blue Hydrogen.
Conclusion: The infrastructure required to generate and transmit blue hydrogen would require rebuilding of the NTS (gas grid) and development of CCS technologies. The ‘technology readiness’ of the Blue Hydrogen route is therefore low.
Carbon Emissions
Carbon emissions due to the Blue Hydrogen process are not zero. Carbon capture from flue gases is not a perfect process. There are a number of available methods and technologies. In general, the higher the effectiveness of carbon capture, the more energy it takes and the less efficient the SMR process becomes [11]. Figure 4 includes one version of the SMR+CCS process, (‘SMR with CO2 capture from flue gas using mono-ethanolamine’), from [11]. This is the most effective available CCS process and results in 90% of Carbon being captured from the SMR. However, this particular SMR+CCS process has an energy efficiency of only 69%. Other SMR+CCS processes have higher energy efficiencies (up to 76%) but CO2 capture rates as low as 53% (ie 47% of carbon escapes into the atmosphere). See [11] for details.
Using data from Table 3 in [11] it is possible to calculate the CO2 emissions from several different available SMR+CCS processes. The range of results is plotted as a horizontal shaded area on Figure 3. It can be seen that the most effective CCS process will emit the same amount of CO2 as a heat pump in 2021 but forever after, it will emit more carbon than a heat pump. The level of fugitive carbon emissions would make it impossible to reach the net zero carbon commitments of the UK government. The worst SMR+CCS process generates carbon emissions nearly as high as a natural gas boiler.
Conclusion: If heat was provide by Blue Hydrogen boilers, fugitive emissions of CO2 would always be significant- at least 10% of the carbon in the input methane, which would prevent ‘net zero’ emissions targets being reached. This contrasts with the heat pump route which would have decreasing emissions with time, reaching near zero by 2040.
It seems that Blue Hydrogen is not so green after all!
Natural gas consumption
Substantially more natural gas would need to be imported or fracked to supply the blue hydrogen process.
From figure 4 it can be seen that for each 100 kWh of ‘input’ natural gas, 45kWh of heat are delivered via the blue hydrogen route. An equivalent calculation for natural gas heating (including compression and pumping losses and the efficiency of a condensing boiler) indicates that for each 100 kWh of natural gas, approximately 65 kWh of heat reaches the consumer. Consequently, the blue hydrogen route requires 65/45 = 1.45 times (45%) more input gas. Since the UK uses 300TWh of gas per year for domestic purposes, mainly for heating [1], this 45% would correspond to importing or fracking an additional 135 TWh of natural gas. This would increase gas imports by 25%, from 520TWh to 655TWh [1]. This would mean that 60% of the nation’s natural gas would be imported, severely impacting energy security. (In fact, National Grid’s future energy scenario sees the UK importing 100% of gas by 2040, because of depleting North Sea reserves. So the additional gas consumption for Blue Hydrogen would make the energy security situation considerably worse.)
Conclusion: The UK would need to use 45% more natural gas for heating if the energy was delivered via blue hydrogen than by natural gas boilers.
Overall Conclusions
The push towards use of Hydrogen for heating is misguided. Burning hydrogen is very inefficient compared with the alternatives. Consequently hydrogen is wasteful of renewable electricity and/or would substantially increase the amount of natural gas used in the country. The carbon emissions caused by burning Blue or Green Hydrogen are significantly higher than those of heat pumps. It is unlikely that the infrastructure needed for a hydrogen economy could be built by 2040.
Hydrogen is a fundamentally poor choice for heating buildings. It should not be on the agenda. A far better strategy is to convert the country’s heating systems to heat pumps. This should be government policy.
References
[2] Renewables UK, ‘Wind Energy Statistics’ https://www.renewableuk.com/page/UKWEDhome/Wind-Energy-Statistics.htm, accessed 26 Sept, 2020.
[3] Anon, ‘Analysis of Turbine Layouts and Spacing Between Wind Farms for Potential New York State Offshore Wind Development’, Report 18-20, Renewables Consulting Group LLC, NY, August, 2018. https://www.nyserda.ny.gov/-/media/Files/Programs/offshore-wind/Analysis-Potential-Turbine-Layouts-Spacing-Between-Wind-Farms.pdf
[4] Watson, S.D et al ‘Decarbonising domestic heating: What is the peak GB demand?’, Energy Policy, Volume 126, March 2019, Pages 533-544. https://doi.org/10.1016/j.enpol.2018.11.001
[5] HM Treasury, ‘The Green Book (2022)’, Section 15, Supplementary Guidance: valuation of energy use and greenhouse gas emissions for appraisal, ‘Data Tables 1 to 19: supporting the toolkit and the guidance’. (Table 1), https://www.gov.uk/government/publications/valuation-of-energy-use-and-greenhouse-gas-emissions-for-appraisal
[6] Anon, ‘The role of refrigeration in the global economy’, 38th Informatory note on refrigeration technologies, International Institute of Refrigeration, June, 2019. https://iifiir.org/en/fridoc/142028
[7] ‘Air source heat pumps vs. ground source heat pumps’, Energy Saving Trust. https://energysavingtrust.org.uk/blog/air-source-heat-pumps-vs-ground-source-heat-pumps
[8] ‘H21 North of England’ project https://www.northerngasnetworks.co.uk/event/h21-launches-national/
[9] ‘Fuels – Higher and Lower Calorific Values’, The Engineering Toolbox, https://www.engineeringtoolbox.com/fuels-higher-calorific-values-d_169.html
[10] Deign, J. ‘Carbon Capture: Silver Bullet or Mirage?’, Greentech Media, December 7, 2020. https://www.greentechmedia.com/articles/read/no-clearer-if-carbon-capture-is-silver-bullet-or-mirage
[11] Collodi et al, ‘Techno-economic Evaluation of Deploying CCS in SMR Based Merchant H2 Production with NG as Feedstock and Fuel’, Energy Procedia, Volume 114, July 2017, pp2690-2712. https://doi.org/10.1016/j.egypro.2017.03.1533